Genome

You are here

GenotypeChecker

GenotypeChecker is a desktop software tool for assisting data cleansing. The application identifies likely data errors in pedigree/genotype data sets by performing an inheritance-checking algorithm for each marker across the pedigree, and highlights inconsistently inherited genotypes in an exploratory user interface. By ‘masking’ suspect datapoints and rechecking inheritance consistency, erroneous datapoints can be confirmed and cleansed from the data set. The software, examples and documentation are freely available at http://bioinformatics.roslin.ac.uk/genotypechecker.

Release Date:
Status:
Availability:
Data type:
Techniques:
Software:
Technology:
Platform:
Requirements:

Project development

Institution: The University of Edinburgh

Gremlin

Gremlin is a novel, interactive visualization model for comparative analysis of structural variants and rearrangements in human and cancer genomes, with emphasis on data integration and uncertainty visualization. Gremli is a genomic rearrangement explorer with multi-scale, linked interactions, which we apply to four human cancer genome data sets for evaluation. Using an insight-based evaluation methodology, we compare Gremlin to Circos, the state-of-the-art in genomic rearrangement visualization, through a small user study with computational biologists working in rearrangement analysis. Results from user study evaluations demonstrate that this visualization model enables more total insights, more insights per minute, and more complex insights than the current state-of-the-art for visual analysis and exploration of genome rearrangements.

Release Date:
Status:
Availability:
Data type:
Techniques:
Software:
Technology:
Platform:
Requirements:

Project development

Institution: Brown University

Variant View


Variant View is a visualization tool for analyzing genetic sequence variants.

Variant View is useful to domain experts in several ways: First, it integrates diverse data types previously distributed across input files and external databases. Second, it provides summary metrics that are valuable for sorting genes and identifying candidates for further exploration. Third, it displays rich information about variant type and distribution across a gene. This information is not available in any other visualization tool and is valuable for interpreting the biological impact of variants, which requires human inspection.

Release Date:
Status:
Availability:
Data type:
Techniques:
Software:
Technology:
Platform:
Requirements:

Project development

Institution: University of British Columbia

Strudel

Strudel is a graphical tool for visualizing genetic and physical maps of genomes for comparative purposes. The application aims to let the user examine their data at a variety of different levels of resolution, from entire maps to individual markers, and explore syntenic relationships between genomes. All browsing and interaction with Strudel happens in real-time – there is no need to wait while the maps are generated.

Strudel is built using Java 1.6 and ships with its own JRE, so there is no need for users to install or update Java.

Features:

  • Visualize multiple genomes and thousands of homologies interactively and in real time
  • Continuous zoom ranging from entire genome views to singles features
  • Explore intervals such as QTLs and list annotation for features
  • Search for features by name
  • Filter homologies on display by BLAST e-value
  • Single genome mode also supported
  • Ships with example dataset to facilitate familiarization with the software
Release Date:
Status:
Availability:
Data type:
Techniques:
Software:
Technology:
Platform:
Requirements:

Project development

Institution: The James Hutton Institute, Dundee University

ARB

The ARB program package comprises a variety of directly interacting software tools for sequence database maintenance and analysis which are controlled by a common graphical user interface. Although it was initially designed for ribosomal RNA data, it can be used for any nucleic and amino acid sequence data as well. A central database contains processed (aligned) primary structure data. Any additional descriptive data can be stored in database fields assigned to the individual sequences or linked via local or worldwide networks. A phylogenetic tree visualized in the main window can be used for data access and visualization. The package comprises additional tools for data import and export, sequence alignment, primary and secondary structure editing, profile and filter calculation, phylogenetic analyses, specific hybridization probe design and evaluation and other components for data analysis. Currently, the package is used by numerous working groups worldwide.

Release Date:
Status:
Availability:
Data type:
Techniques:
Software:
Technology:
Platform:
Requirements:

Project development

Institution:

Jalview

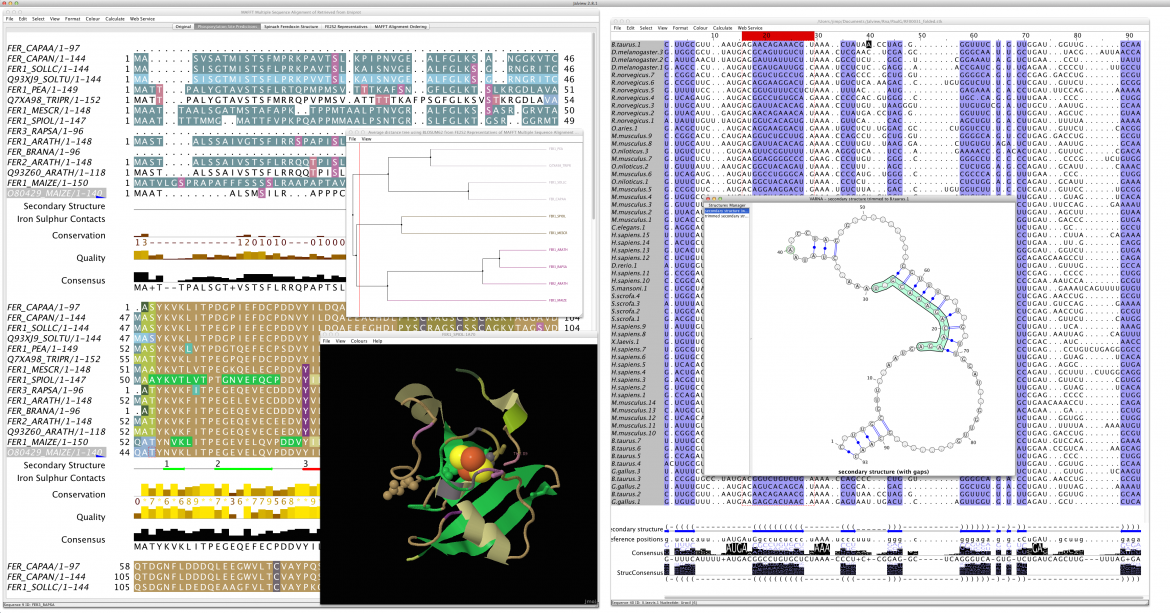
Jalview is a free program for protein and nucleic acid multiple sequence alignment editing, visualisation and analysis. Use it to view and edit sequence alignments, analyse them with phylogenetic trees and principal components analysis (PCA) plots and explore molecular structures and annotation. Jalview has built in DNA, RNA and protein sequence and structure visualisation and analysis capabilities. It uses Jmol to view 3D structures, and VARNA to display RNA secondary structure. The Jalview Desktop can also connect with databases and analysis services, and provides a graphical interface to the alignment and analysis services provided by the JavA Bioinformatics Analysis Web Services framework.  From Jalview 2.8.2, the Jalview desktop also interfaces with the Chimera molecular visualisation system to provide powerful 3D graphics tightly coupled to Jalview's functions.

Release Date:
Status:
Availability:
Data type:
Techniques:
Software:
Technology:
Platform:
Requirements:

Project development

Institution: University of Dundee

Tableau

Tableau is general purpose data visualization software that's been used at the Broad Institute since 2010 for analyzing, monitoring, and optimizing genomic sequencing operations. The Broad's cancer group is also using Tableau for genotype expression data. Tableau connects to all standard business databases (e.g. Oracle, MySQL) and file types (e.g. CSV, Excel). 

Release Date:
Status:
Availability:
Data type:
Techniques:
Software:
Technology:
Platform:
Requirements:

Project development

Institution: Broad Institute of MIT and Harvard

IGV

The Integrative Genomics Viewer (IGV) is a high-performance visualization tool for interactive exploration of large, integrated genomic datasets. It supports a wide variety of data types, including array-based and next-generation sequence data, and genomic annotations.

Release Date:
Status:
Availability:
Data type:
Techniques:
Software:
Technology:
Platform:
Requirements:

Project development

Institution: Broad Insitute

Gitools

Gitools is a desktop application for analysis and visualization of multidimensional data using interactive heat-maps.

Release Date:
Status:
Availability:
Data type:
Techniques:
Software:
Technology:
Platform:
Requirements:

Project development

Institution: University Pompeu Fabra, Barcelona

MCA

Multiresolution Correlation Analysis (MCA) is a method for visually identifying subpopulations based on the local pairwise correlation between covariates, without needing to define an a priori interaction scale. MCA facilitates the identification of differentially regulated subpopulations in simulated data from a small gene regulatory network. MCA recovers previously identified subpopulations, provides additional insight into the underlying correlation structure, reveals potentially spurious compartmentalizations, and provides insight into novel subpopulations. MCA is a useful method for the identification of subpopulations in low-dimensional expression data, as emerging from qPCR or FACS measurements. With MCA it is possible to investigate the robustness of covariate correlations with respect subpopulations, graphically identify outliers, and identify factors contributing to differential regulation between pairs of covariates. MCA thus provides a framework for investigation of expression correlations for genes of interests and biological hypothesis generation.

Release Date:
Status:
Availability:
Data type:
Techniques:
Software:
Technology:
Platform:
Requirements:

Project development

Institution: Helmholtz Zentrum Munchen; Department of Mathematics, Technical University of Munich

Pages