Image data

You are here

PhenoPlot

PhenoPlot is a glyph-based visualization method of multidimensional image-based phenotypic data. It facilitates data interpretation and analysis by providing a pictorial quantitative representation of the data. It can be used to represent cell image data including shape measurements of the cell or nuclei, texture, intensity, and protrusions. It can also represent tumor data such as tumor size, grade and cellularity. Currently, PhenoPlot offers 21 elements that the user can assign to their measurements of choice.

PhenoPlot is a free and open source Matlab toolbox that comes with a graphical user interface (GUI).


Release Date:
Status:
Availability:
Data type:
Techniques:
Software:
Technology:
Platform:
Requirements:

Project development

Institution: Institute of Cancer Research

MARender

MARender is a JavaScript 3D rendering system based on three.js (http://threejs.org/).

The rendering system is centred around a JavaScript class MARenderer and aimed at simple web-based visualisation of 3D bio-medical datasets, with particular emphasis on anatomy and mapped spatial data (eg gene expression).

Typical uses combine surface, section and point cloud renderings. Surfaces and point clouds are most readily read from VTK format files using the modified VTK loader https://github.com/ma-tech/three.js/blob/master/examples/js/loaders/MAVTKLoader.js and sections either from static images or from an IIP3D server (https://github.com/ma-tech/WlzIIPSrv).

Release Date:
Status:
Availability:
Data type:
Techniques:
Software:
Technology:
Platform:
Requirements:

Project development

Institution: MRC Institute of Genetics & Molecular Medicine, The University of Edinburgh

ClearVolume

ClearVolume is a real-time live 3D visualization library designed for high-end volumetric microscopes such as SPIM and DLSM microscopes. With ClearVolume you can see live on your screen the stacks acquired by your microscope instead of waiting for offline post-processing to give you an intuitive and comprehensive view on your data. The biologists can immediately decide whether a sample is worth imaging.ClearVolume can easily be integrated into existing Java, C/C++, Python, or LabVIEW based microscope software. It has a dedicated interface to MicroManager/OpenSpim/OpenSpin control software. ClearVolume supports multi-channels, live 3D data streaming from remote microscopes, and uses a multi-pass Fibonacci rendering algorithm that can handle large volumes. Moreover, ClearVolume is integrated into the Fiji/ImageJ2/KNIME ecosystem. You can now open your stacks with ClearVolume from within these popular frameworks for offline viewing.

Release Date:
Status:
Availability:
Data type:
Techniques:
Software:
Technology:
Platform:
Requirements:

Project development

Institution: Center for Systems Biology & Max Planck Institute for Molecular Cell Biology and Genetics, Dresden, Germany; Technische Universität Dresden, Dresden, Germany

IBM UKSC history

The IBM United Kingdom Scientific Centre in Winchester over the 1980's had two complementary groups devoted to visualization; graphics and image processing.  We had a strong emphasis on applications, working with various external partners (including Michael Sternberg).  For the graphics group the applications included molecular graphics, archaeology and computer art; the image group was mainly dedicated to medical imaging.  There were a few cross-over projects, for example the creation of a 'beating heart' movie .  The tools we used are no longer available and are included here for historical and archive purposes.

The graphics groups had serveral main tools

  • Winchester Graphics System (WGS) was used for data exploration; it combined relational database technology and interactive 3d graphics with an bridge between the two and scripting.
  • Winchester Solid Modeller (WINSOM) was used for more advanced graphical visualizations.  It combined constructive solid geometry (CSG) with novel methods for blending (e.g. metaballs) and representations of molecular fields.
  • FASTDRAW, which converted the same CSG/field models to polygon for for interactive 3d display.
  • Extensible Solid Model Editor (ESME), for more powerful graphics programming, integrated with generation of WINSOM/FASTDRAW models.

The image processing group had a single tool

  • IAX which incorporated many image processing techniques (some novel) within a simple scriptable framework.  This performed 2d and 3d image analysis, with 3d recognition often passed to Winsom for final display.

The groups had a demonstration prepared for presentation to our visitors.  I have recovered much of this, in particular the still images, and recast it as a web page which is currently available at http://programbits.co.uk/UKSC/uksc.html.  The content was biased toward the graphics group.  Much of the content cannot be displayed, especially the movies (which I hope to preapare in suitable format soon) and the interactive 3d work (which may never be recreated).

The Journal of Molecular Graphics was founded by Andy Morffew, a member of the group;  you may see a disproportionate number of our papers in the early volumes.

Some of the work continues to this day.  William Latham and I are presenting exhibitions of interactive 3d art (one in Norwich in Autumn 2016).  We have a modern version of FASTDRAW (in C#/Unity) which is being used as part of BioBlox, and which I hope to release as open source soon.  There is also a Java version which FoldSynth uses for metaballs.


Release Date:
Status:
Availability:
Data type:
Techniques:
Software:
Technology:
Platform:
Requirements:

Project development

Institution: IBM United Kingdom Scientific Centre

Historical

eHistology Atlas

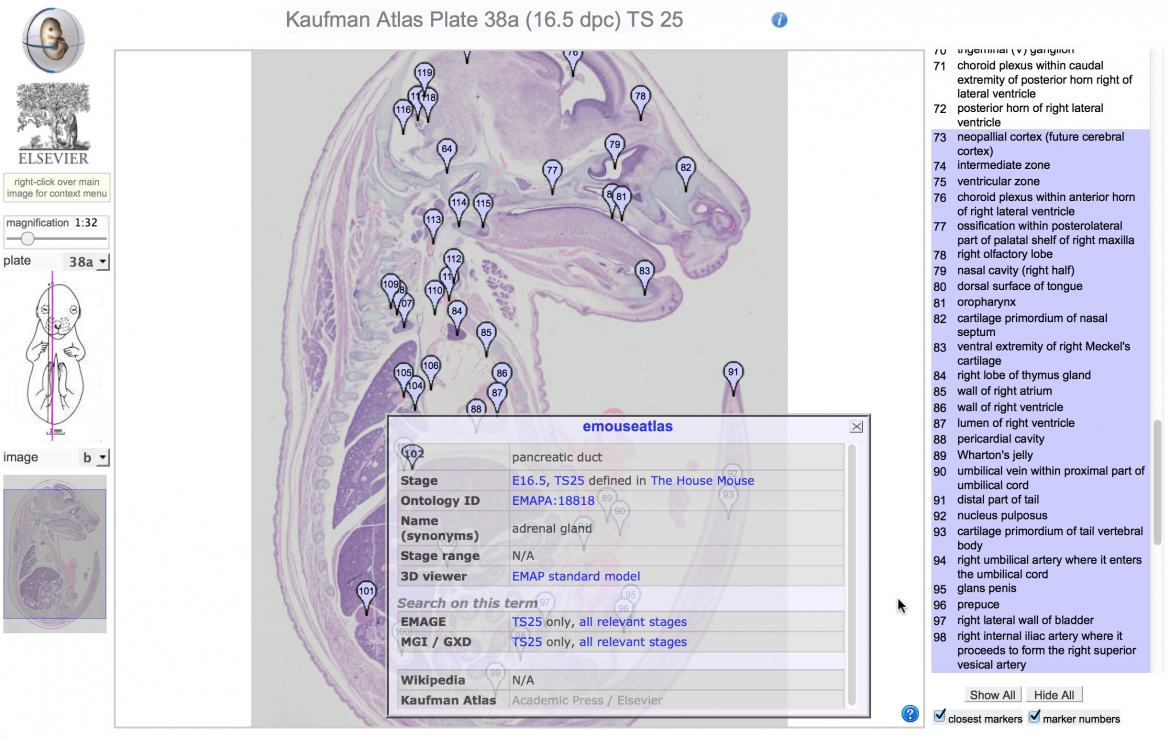
The eHistology Atlas is a Javascript-based zoom viewer of large 2D histology images with anatomy annotations provided via point locations that can be selected to show additional imformation. The tiled images are provided by an Image Internet Protocol (IIP) server and the anatomy annotations from a mySQL database. All software is available from the matech GitHub repository https://github.com/ma-tech. The browser code is Javascript and tested on Firefox, Chrome and Safari. The eMouseAtlas resource provide access to the eHistology Atlas.

Release Date:
Status:
Availability:
Data type:
Techniques:
Software:
Technology:
Platform:
Requirements:

Project development

Institution: MRC Human Genetics Unit, University of Edinburgh

Integrated Genome Browser

The Integrated Genome Browser (IGB, pronounced Ig-Bee) is a fast, flexible, and free desktop genome browser. First developed at Affymetrix in 2001 to support visual analytics of genome tiling arrays, IGB provides an advanced, highly customizable environment for exploring and analyzing large-scale genomic data sets.

Using IGB, you can:

  • View your RNA-Seq, ChIP-chip or ChIP-seq data alongside genome annotations and sequence.
  • Investigate alternative splicing, regulation of gene expression, epigenetic modifications of DNA, and other genome-scale questions.
  • View results from aligning short-read sequences onto a target genome, identify SNPs, and check alignment quality.
  • Copy and paste genomic sequences for further analysis into other tools, such as primer design and promoter analysis tools.
  • Create high-quality images for publication in a variety of formats.


IGB features

IGB lets you view results from your own experiments or computational analyses alongside public domain gene annotations, sequences, and genomic data sets, thus making it easier for you to determine how your experiments agree or disagree with current thinking and models of genomic structure.

Some features IGB offers include:

  • Animated zooming. Most genome browsers implement "jump zooming" only, in which you click a zoom button (or other type of control) and then wait for the display to re-draw. In IGB, zooming is animated, allowing you to easily and quickly adjust the zoom level as needed without losing track of your location.
  • Simple Data Sharing System - QuickLoad. IGB implements a very simple, easy-to-use system for sharing data called QuickLoad. You can use the QuickLoad system to set up a Web site you can use to share your data with colleagues, reviewers, and the public.
  • Draggable graphs. You can display genome graphs data (e.g., "bar" and "wiggle" files) alongside and even on top of reference genome annotations, thus making it easier to see how your experimental results match up to the published reference genome annotations. You can reset your graphs to "floating" and click-drag them over annotations to compare your results with annotations and others' experiments.
  • Edge-matching across tracks. When you click an item in the display, the edges of other items in the same or different tracks with identical boundaries light up, highlighting interesting similarities or differences across gene models, sequence reads, or other features.
  • Integration with local and remote external data sources. IGB can load data from a variety of sources, including Distributed Annotation Servers, QuickLoad servers, ordinary Web sites, and local files.
  • Intron-trimming sliced view. In many species, introns are huge when compared to the exonic (coding) regions of genes. IGB provides a Sliced View tab that trims uninformative regions from introns.
  • Web-controls. IGB can be controlled from a web browser or any other program capable of sending HTTP requests. Via IGB links, you can create Web pages that direct IGB to scroll to a specific region and load data sets from local files or servers.
  • Scripting. IGB understands a simple command language that allows users to write simple scripts directing IGB to show a genome, zoom and scroll to specific regions, and other functions.
  • Open source. All development on IGB proceeds via a 100% open source model. The license allows developers to incorporate IGB (and its components) into new applications.
Release Date:
Status:
Availability:
Data type:
Techniques:
Software:
Technology:
Platform:
Requirements:

Project development

Institution: UNC @ Charlotte

Vaa3D

Vaa3D(in Chinese ‘挖三维’) is an Open Source visualization and analysis software suite created mainly by Hanchuan Peng and his team at Janelia Research Campus, HHMI and Allen Institute for Brain Science. The software performs 3D, 4D and 5D rendering and analysis of very large image data sets, especially those generated using various modern microscopy methods, and associated 3D surface objects. This software has been used in several large neuroscience initiatives and a number of applications in other domains. It has been viewed as one of the leading Open Source software suites in the related research fields. It has also been used in several other award-winning work, e.g. mapping of dragonfly neurons and large-scale visualization of cellular data.

Release Date:
Status:
Availability:
Data type:
Techniques:
Software:
Technology:
Platform:
Requirements:

Project development

Institution: Janelia Research Campus, HHMI; Allen Institute for Brain Science

OMERO

From the microscope to publication, OMERO handles all your images in a secure central repository. You can view, organize, analyze and share your data from anywhere you have internet access. Work with your images from a desktop app (Windows, Mac or Linux), from the web or from 3rd party software. Over 130 image file formats supported, including all major microscope formats.

Release Date:
Status:
Availability:
Data type:
Techniques:
Software:
Technology:
Platform:
Requirements:

Project development

Institution: University of Dundee

http://www.openmicroscopy.org/site/about/development-teams/jason

Sunburst view of in situ gene-expression data from EMAGE

The eMouse Atlas of Gene Expression (EMAGE) is an online resource that publishes the results of in situ gene expression experiments on the developmental mouse. The resource provides comprehensive search facilities, but few analytical tools or visual mechanisms for navigating the data set.

Release Date:
Status:
Availability:
Data type:
Techniques:
Software:
Technology:
Platform:
Requirements:

Project development

Institution: Heriot-Watt University

Morphometric Visualisation

This SDM is based on dense registrations of the input shapes. For a valuable exploration of the shape space in the setting of biological morphometrics two prominent objectives for visual investigation have been identified. The first objective is to detect possible shape variations between anatomically different groups of individuals. The second is to integrate and exploit expert knowledge about relevant regions on the shapes. The first objective can be achieved through the use of dimensionality reduction methods combined with a parameterization defined on user specified classifications. This idea was already successfully applied in data-driven reflectance models and also turns out to be valuable in the context of biological morphometry, as it allows for intuitive exploration of shape variations. The second objective can be achieved by an appropriate weighted linear analysis which delivers a better approximation of shape variations in local neighbourhoods of a user defined region of interest. The methods were applied to real-world biological datasets of rodent mandibles and validated in cooperation with the MPI for Evolutionary Biology. This interactive dynamic visualization of the shape space is based on a custom GPU raycaster.

Release Date:
Status:
Availability:
Data type:
Techniques:
Software:
Technology:
Platform:
Requirements:

Project development

Institution: Institute of Computer Science II University of Bonn, Max-Planck-Institute of Evolutionary Biology Plön

This work was supported in part by NRW State within the B-IT Research School.

Pages