Free

You are here

Free license for normal use

ALVIS

Alvis is an open-source platform for the joint explorative analysis of MSAs and phylogenetic trees, employing Sequence Bundles as its main visualization method. Alvis combines the power of the visualization method with an interactive toolkit allowing detection of covariant sites, annotation of trees with synapomorphies and homoplasies, and motif detection. It also offers numerical analysis functionality, such as dimension reduction and classification. Alvis is user-friendly, highly customizable and can export results in publication-quality figures. It is available as a full-featured standalone version (http://www.bitbucket.org/rfs/alvis) and its Sequence Bundles visualization module is further available as a web application (http://science-practice.com/projects/sequence-bundles).

Release Date:
Status:
Availability:
Data type:
Techniques:
Software:
Technology:
Platform:
Requirements:

Project development

Institution: Goldman Group, EMBL-EBI; Science Practice

Reactome

REACTOME is an open-source, open access, manually curated and peer-reviewed pathway database. Pathway annotations are authored by expert biologists, in collaboration with Reactome editorial staff and cross-referenced to many bioinformatics databases. These include NCBI GeneEnsembl and UniProt databases, the UCSC Genome Browser, the KEGG Compound and ChEBI small molecule databases, PubMed, and Gene Ontology.

The rationale behind Reactome is to convey the rich information in the visual representations of biological pathways familiar from textbooks and articles in a detailed, computationally accessible format. The core unit of the Reactome data model is the reaction. Entities (nucleic acids, proteins, complexes, vaccines, anti-cancer theraputics and small molecules) participating in reactions form a network of biological interactions and are grouped into pathways. Examples of biological pathways in Reactome include classical intermediary metabolism, signaling, innate and acquired immune function, transcriptional regulation, apoptosis and disease.

Reactome provides an intuitive website to navigate pathway knowledge and a suite of data analysis tools to support the pathway-based analysis of complex experimental and computational data sets. Visualisation of Reactome data is facilitated by the Pathway Browser, a Systems Biology Graphical Notation (SBGN)-based interface, that supports zooming, scrolling and event highlighting. It exploits the PSIQUIC web services to overlay molecular interaction data from the Reactome Functional Interaction Network and external interaction databases such as IntActChEMBLBioGRID and iRefIndex.

Pathway Analysis tools analyze user-supplied datasets permitting ID mapping, pathway assignment and over-representation or enrichment analysis. The curated human pathway data are used to infer orthologous events in 17 non-human species including mouse, rat, chicken, worm, fly, yeast and plant. Species Comparison tool allows users to compare predicted pathways with those of human to find reactions and pathways common to a selected species and human. Additional pathway databases based upon the Reactome data model have been created by collaborating groups for the fruit fly, the chicken, and the plant Arabidopsis.

Release Date:
Status:
Availability:
Data type:
Techniques:
Software:
Technology:
Platform:
Requirements:

Project development

Institution: Ontario Institute for Cancer Research; European Bioinformatics Institute; New York University Medical Center

xiNET

xiNET is a visualization tool for exploring cross-linking/mass spectrometry results. The interactive maps of the cross-link network that it generates are a type of node-link diagram. In these maps xiNET displays: (1) residue resolution positional information including linkage sites and linked peptides; (2) all types of cross-linking reaction product; (3) ambiguous results; and, (4) additional sequence information such as domains. xiNET runs in a browser and exports vector graphics which can be edited in common drawing packages to create publication quality figures.

Release Date:
Status:
Availability:
Data type:
Techniques:
Software:
Technology:
Platform:
Requirements:

Project development

Institution: Rappsilber Laboratory, The University of Edinburgh

Supramap

Supramap is a completely new method of generating and sharing knowledge about evolution and biogeography.  A supramap gives people a quick and easy way to integrate genotypic and phenotypic data in a geospatial context. When viewed in a virtual globe (e.g. Google Earth or NASA WorldWind), the user has an interactive map of the spread of various lineages of organisms (e.g. strains of pathogens) over the earth.

Release Date:
Status:
Availability:
Data type:
Techniques:
Software:
Technology:
Platform:
Requirements:

Project development

Institution: UNC Charlotte

OneZoom

OneZoom is an interactive map of the evolutionary relationships between the species on our planet. Trees with millions of tips, richly embellished with additional data, can now be easily explored within the web browser of any modern hardware with a zooming user interface similar to that used in Google Maps.

Release Date:
Status:
Availability:
Data type:
Techniques:
Software:
Technology:
Platform:
Requirements:

Project development

Institution: OneZoom CIO & Imperial College London

Version 1 developed at Imperial College London. Version 2 and 3 developed at OneZoom CIO.

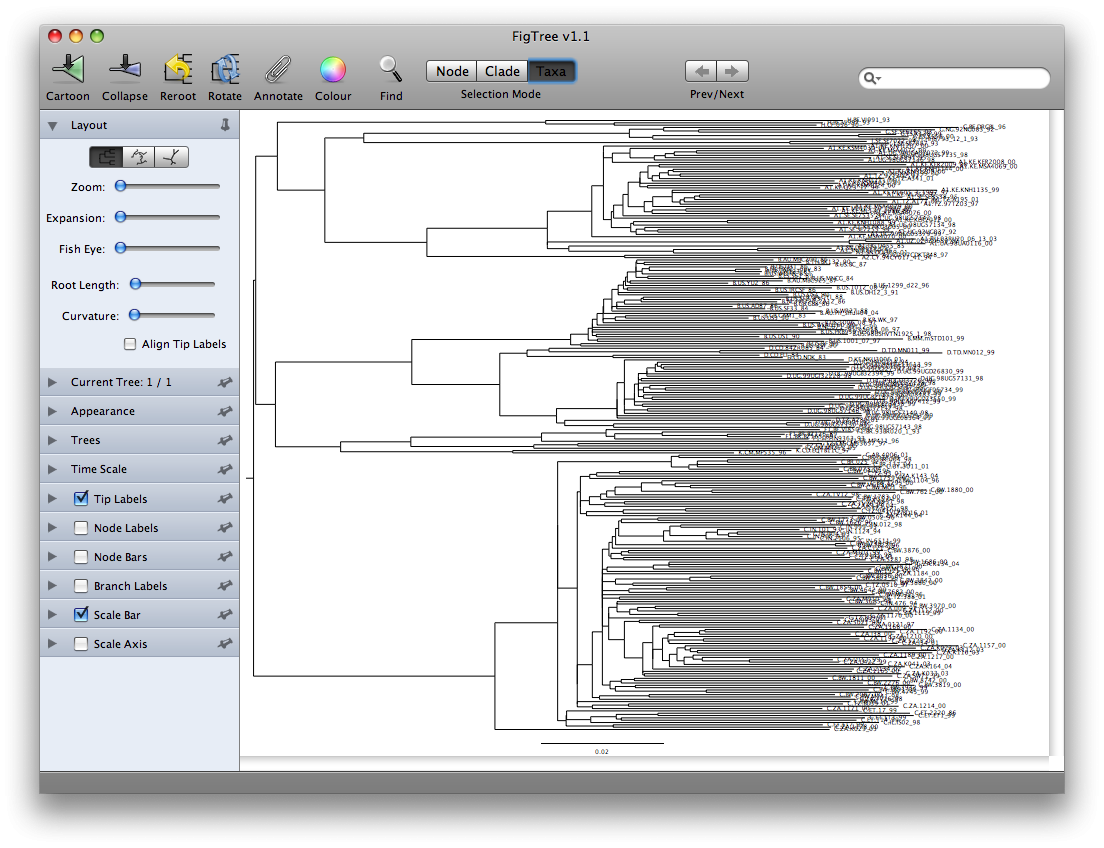
FigTree

FigTree is designed as a graphical viewer of phylogenetic trees and as a program for producing publication-ready figures. It is designed to display summarized and annotated trees produced by BEAST.

Release Date:
Status:
Availability:
Data type:
Techniques:
Software:
Technology:
Platform:
Requirements:

Project development

Institution: The University of Edinburgh

Epiviz

Visualization is an integral aspect of genomics data analysis. Algorithmic-statistical analysis and interactive visualization are most effective when used iteratively. Epiviz, a web-based genome browser, and the Epivizr Bioconductor package allow interactive, extensible and reproducible visualization within a state-of-the-art data-analysis platform.

Release Date:
Status:
Availability:
Data type:
Techniques:
Software:
Technology:
Platform:
Requirements:

Project development

Institution: University of Maryland, USA

VisRseq

VisRseq is a framework for analysis of sequencing datasets that provides a computationally rich and accessible framework for integrative and interactive analyses without requiring programming expertise. Features include R apps, which offer a semi-auto generated and unified graphical user interface for computational packages in R and repositories such as Bioconductor. To address the interactivity limitation inherent in R libraries, the framework includes several native apps that provide exploration and brushing operations as well as an integrated genome browser. The apps can be chained together to create more powerful analysis workflows.

Release Date:
Status:
Availability:
Data type:
Techniques:
Software:
Technology:
Platform:
Requirements:

Project development

Institution: GrUVi Lab, Simon Fraser University, Canada

expVIP

expVIP is an expression visualization and integration platform, which allows easy analysis of RNA-seq data combined with an intuitive and interactive interface. Users can analyze public and user-specified data sets with minimal bioinformatics knowledge using the expVIP virtual machine. This generates a custom Web browser to visualize, sort, and filter the RNA-seq data and provides outputs for differential gene expression analysis.

Release Date:
Status:
Availability:
Data type:
Techniques:
Software:
Technology:
Platform:
Requirements:

Project development

Institution: John Innes Centre, Norwich; Genome Analysis Centre, Norwich

panX

panX is a powerful interactive platform for pan-genome exploration. It provides multiple different views on annotated genomes and allows rapid search by gene name, diversity, duplications, etc. Strain-specific meta data is integrated into the phylogenetic tree viewer such that associations between gene presence and phenotypes can be spotted.

Release Date:
Status:
Availability:
Data type:
Techniques:
Software:
Technology:
Platform:
Requirements:

Project development

Institution: Max Planck Institute for Developmental Biology, Tuebingen, Germany

Pages