Proteomics

You are here

Listeriomics

As for many model organisms, the amount of Listeria omics data produced has recently increased exponentially. There are now >80 published complete Listeria genomes, around 350 different transcriptomic data sets, and 25 proteomic data sets available. The analysis of these data sets through a systems biology approach and the generation of tools for biologists to browse these various data are a challenge for bioinformaticians. We have developed a web-based platform, named Listeriomics, that integrates different tools for omics data analyses, i.e., (i) an interactive genome viewer to display gene expression arrays, tiling arrays, and sequencing data sets along with proteomics and genomics data sets; (ii) an expression and protein atlas that connects every gene, small RNA, antisense RNA, or protein with the most relevant omics data; (iii) a specific tool for exploring protein conservation through the Listeria phylogenomic tree; and (iv) a coexpression network tool for the discovery of potential new regulations. Our platform integrates all the complete Listeria species genomes, transcriptomes, and proteomes published to date. This website allows navigation among all these data sets with enriched metadata in a user-friendly format and can be used as a central database for systems biology analysis.

Release Date:
Status:
Availability:
Data type:
Techniques:
Software:
Technology:
Platform:
Requirements:

Project development

Institution: Institut Pasteur

Developed in Java using Eclipse RCP/RAP API


Aquaria

Aquaria is a free and open-source web resource for biologists that simplifies the process of gaining insight from protein structures. For all SwissProt protein sequences, Aquaria provides a concise visual summary of all related 3D structures, and the facility to map features onto related structures (e.g., SNPs, PTMs, domains, etc.), including user-defined features.

Release Date:
Status:
Availability:
Data type:
Techniques:
Software:
Technology:
Platform:
Requirements:

Project development

Institution: Technische Universität München, Germany; Garvan Institute of Medical Research, Sydney, Australia; CSIRO Computational Informatics, Sydney, Australia

RCSB Protein Data Bank

The Research Collaboratory for Structural Bioinformatics Protein Data Bank (RCSB PDB, rcsb.org) is an open access resource powered by the Protein Data Bank archive-information about the 3D shapes of proteins, nucleic acids, and complex assemblies. As a member of the worldwide Protein Data Bank, the RCSB PDB curates and annotates PDB data. The RCSB PDB enhances the value of the data by creating tools and resources for research and education in molecular biology, structural biology, computational biology, and beyond. PDB-101 is an educational portal (pdb101.rcsb.org) for teachers, students, and the general public that promotes exploration in the world of proteins and nucleic acids. Learning about the diverse shapes and functions of these biological macromolecules helps to understand many aspects of biomedicine and agriculture, from protein synthesis to health and disease to biological energy.

Release Date:
Status:
Availability:
Data type:
Techniques:
Software:
Technology:
Platform:
Requirements:

Project development

Institution: Rutgers, The State University of New Jersey Center for Integrative Proteomics Research, NJ

I-PV

Today’s genome browsers and protein databanks supply vast amounts of information about proteins. The challenge is to concisely bring together this information in an interactive, easy to generate and an aesthetic format. Moreover, our goal is to make this data accessible to not only biologists/geneticists, but also medical doctors, patients and young students by using custom and intuitive interfaces that are effective. We have developed an interactive CIRCOS module called i-PV to visualize user supplied protein sequence, conservation, variation and related metadata in a live presentable layout that unites the figure generation, live presentation, customization and analysis in a single-page html application.

Release Date:
Status:
Availability:
Data type:
Techniques:
Software:
Technology:
Platform:
Requirements:

Project development

Institution: VUB, Brussels, Belgium; KUL, Leuven, Belgium; UZ Brussel, Brussels, Belgium

Integrated Genome Browser

The Integrated Genome Browser (IGB, pronounced Ig-Bee) is a fast, flexible, and free desktop genome browser. First developed at Affymetrix in 2001 to support visual analytics of genome tiling arrays, IGB provides an advanced, highly customizable environment for exploring and analyzing large-scale genomic data sets.

Using IGB, you can:

  • View your RNA-Seq, ChIP-chip or ChIP-seq data alongside genome annotations and sequence.
  • Investigate alternative splicing, regulation of gene expression, epigenetic modifications of DNA, and other genome-scale questions.
  • View results from aligning short-read sequences onto a target genome, identify SNPs, and check alignment quality.
  • Copy and paste genomic sequences for further analysis into other tools, such as primer design and promoter analysis tools.
  • Create high-quality images for publication in a variety of formats.


IGB features

IGB lets you view results from your own experiments or computational analyses alongside public domain gene annotations, sequences, and genomic data sets, thus making it easier for you to determine how your experiments agree or disagree with current thinking and models of genomic structure.

Some features IGB offers include:

  • Animated zooming. Most genome browsers implement "jump zooming" only, in which you click a zoom button (or other type of control) and then wait for the display to re-draw. In IGB, zooming is animated, allowing you to easily and quickly adjust the zoom level as needed without losing track of your location.
  • Simple Data Sharing System - QuickLoad. IGB implements a very simple, easy-to-use system for sharing data called QuickLoad. You can use the QuickLoad system to set up a Web site you can use to share your data with colleagues, reviewers, and the public.
  • Draggable graphs. You can display genome graphs data (e.g., "bar" and "wiggle" files) alongside and even on top of reference genome annotations, thus making it easier to see how your experimental results match up to the published reference genome annotations. You can reset your graphs to "floating" and click-drag them over annotations to compare your results with annotations and others' experiments.
  • Edge-matching across tracks. When you click an item in the display, the edges of other items in the same or different tracks with identical boundaries light up, highlighting interesting similarities or differences across gene models, sequence reads, or other features.
  • Integration with local and remote external data sources. IGB can load data from a variety of sources, including Distributed Annotation Servers, QuickLoad servers, ordinary Web sites, and local files.
  • Intron-trimming sliced view. In many species, introns are huge when compared to the exonic (coding) regions of genes. IGB provides a Sliced View tab that trims uninformative regions from introns.
  • Web-controls. IGB can be controlled from a web browser or any other program capable of sending HTTP requests. Via IGB links, you can create Web pages that direct IGB to scroll to a specific region and load data sets from local files or servers.
  • Scripting. IGB understands a simple command language that allows users to write simple scripts directing IGB to show a genome, zoom and scroll to specific regions, and other functions.
  • Open source. All development on IGB proceeds via a 100% open source model. The license allows developers to incorporate IGB (and its components) into new applications.
Release Date:
Status:
Availability:
Data type:
Techniques:
Software:
Technology:
Platform:
Requirements:

Project development

Institution: UNC @ Charlotte

Jalview

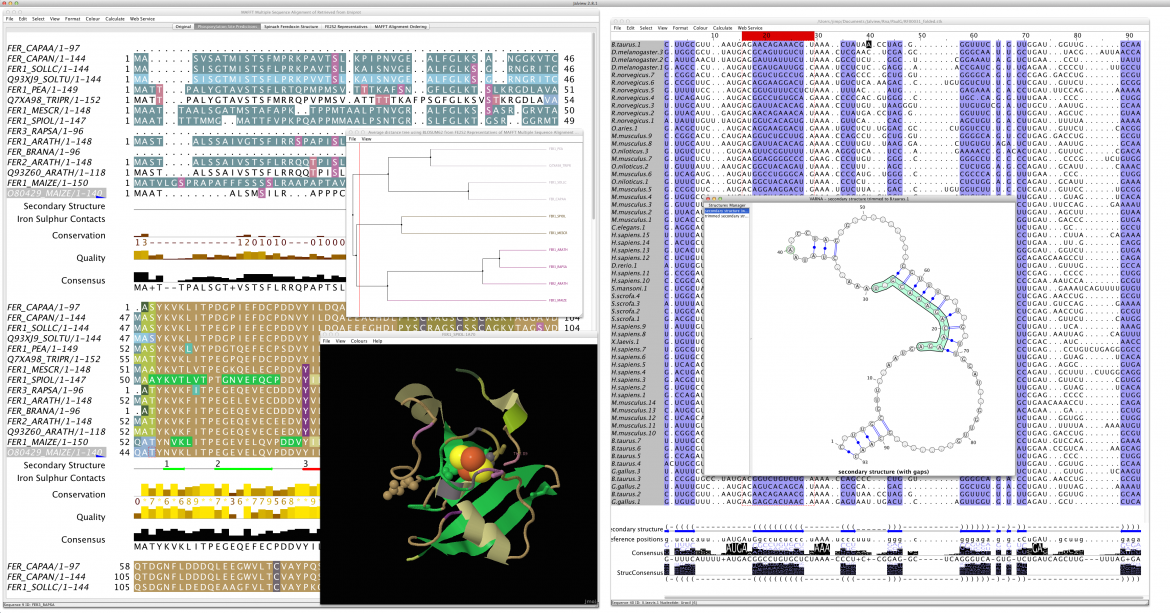
Jalview is a free program for protein and nucleic acid multiple sequence alignment editing, visualisation and analysis. Use it to view and edit sequence alignments, analyse them with phylogenetic trees and principal components analysis (PCA) plots and explore molecular structures and annotation. Jalview has built in DNA, RNA and protein sequence and structure visualisation and analysis capabilities. It uses Jmol to view 3D structures, and VARNA to display RNA secondary structure. The Jalview Desktop can also connect with databases and analysis services, and provides a graphical interface to the alignment and analysis services provided by the JavA Bioinformatics Analysis Web Services framework.  From Jalview 2.8.2, the Jalview desktop also interfaces with the Chimera molecular visualisation system to provide powerful 3D graphics tightly coupled to Jalview's functions.

Release Date:
Status:
Availability:
Data type:
Techniques:
Software:
Technology:
Platform:
Requirements:

Project development

Institution: University of Dundee