Actively maintained

You are here

Tool is being activelty miantained. This tool is considered complete. Bugs will be fixed, but no new features will be added 

HerbariaViz

HerbariaViz is a web mapping application that provides space–time–species data query responses efficiently. The open-source methods for aggregating point data spatially and temporally, outline our approach to sound cartographic representations of those data, and detail the design of a client interface for making requests and mapping responses. A focus group session involving domain experts was performed to provide user evaluation of the application. In our discussion, we present potential avenues of future work, including: facilitating query response comparisons, handling incomplete and inaccurate data, and generalizing the method presented.

Release Date:
Status:
Availability:
Data type:
Techniques:
Software:
Technology:
Platform:
Requirements:

Project development

Institution: GeoVISTA Center, Penn State University

VTK

The Visualization Toolkit (VTK) is an open-source, freely available software system for 3D computer graphics, image processing and visualization. Kitware, whose team created and continues to extend the toolkit, offers professional support and consulting services for VTK. VTK supports a wide variety of visualization algorithms including: scalar, vector, tensor, texture, and volumetric methods; and advanced modeling techniques such as: implicit modeling, polygon reduction, mesh smoothing, cutting, contouring, and Delaunay triangulation. VTK has an extensive information visualization framework, has a suite of 3D interaction widgets, supports parallel processing, and integrates with various databases on GUI toolkits such as Qt and Tk.

Release Date:
Status:
Availability:
Data type:
Techniques:
Software:
Technology:
Platform:
Requirements:

Project development

Institution: Kitware, Inc.

Circos

Circos is a software package for visualizing data and information. It visualizes data in a circular layout — this makes Circos ideal for exploring relationships between objects or positions. There are other reasons why a circular layout is advantageous, not the least being the fact that it is attractive. Circos is ideal for creating publication-quality infographics and illustrations with a high data-to-ink ratio, richly layered data and pleasant symmetries. You have fine control each element in the figure to tailor its focus points and detail to your audience.

Release Date:
Status:
Availability:
Data type:
Techniques:
Software:
Technology:
Platform:
Requirements:

Project development

Institution: Genome Science Centre, BC Cancer Agency, Vancouver

Silva Tree Viewer

The SILVA Tree Viewer is a web application to browse and query the SILVA guide trees. 

The SILVA rRNA database project is a comprehensive on-line resource for quality checked and aligned ribosomal RNA sequence data.

Release Date:
Status:
Availability:
Data type:
Techniques:
Software:
Technology:
Platform:
Requirements:

Project development

Institution: Max Planck Institute for Marine Microbiology

ARB

The ARB program package comprises a variety of directly interacting software tools for sequence database maintenance and analysis which are controlled by a common graphical user interface. Although it was initially designed for ribosomal RNA data, it can be used for any nucleic and amino acid sequence data as well. A central database contains processed (aligned) primary structure data. Any additional descriptive data can be stored in database fields assigned to the individual sequences or linked via local or worldwide networks. A phylogenetic tree visualized in the main window can be used for data access and visualization. The package comprises additional tools for data import and export, sequence alignment, primary and secondary structure editing, profile and filter calculation, phylogenetic analyses, specific hybridization probe design and evaluation and other components for data analysis. Currently, the package is used by numerous working groups worldwide.

Release Date:
Status:
Availability:
Data type:
Techniques:
Software:
Technology:
Platform:
Requirements:

Project development

Institution:

Jalview

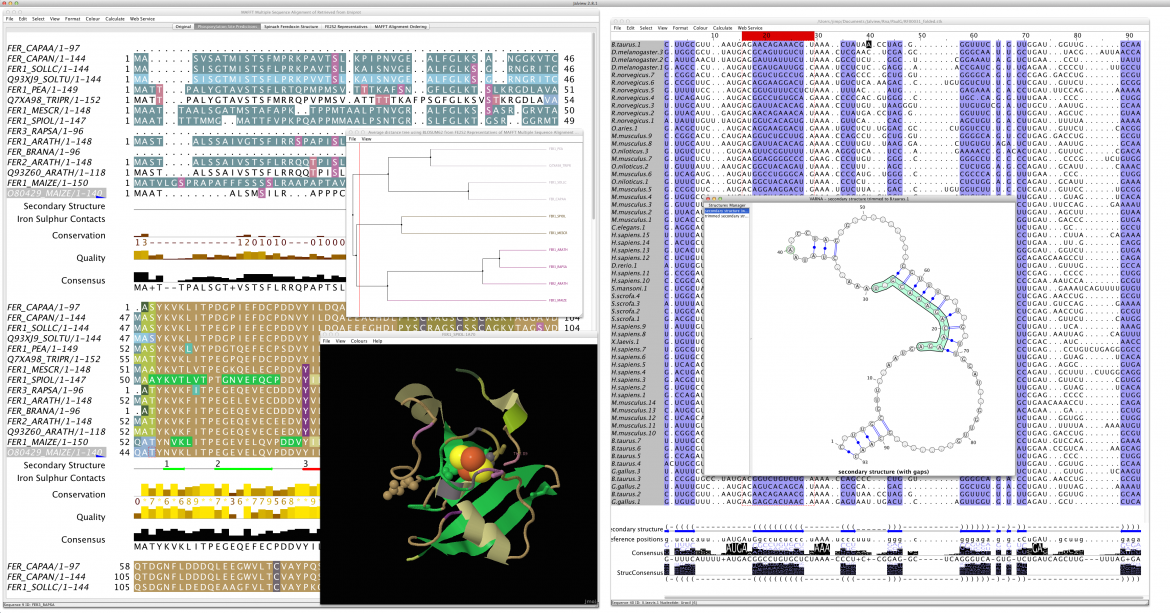
Jalview is a free program for protein and nucleic acid multiple sequence alignment editing, visualisation and analysis. Use it to view and edit sequence alignments, analyse them with phylogenetic trees and principal components analysis (PCA) plots and explore molecular structures and annotation. Jalview has built in DNA, RNA and protein sequence and structure visualisation and analysis capabilities. It uses Jmol to view 3D structures, and VARNA to display RNA secondary structure. The Jalview Desktop can also connect with databases and analysis services, and provides a graphical interface to the alignment and analysis services provided by the JavA Bioinformatics Analysis Web Services framework.  From Jalview 2.8.2, the Jalview desktop also interfaces with the Chimera molecular visualisation system to provide powerful 3D graphics tightly coupled to Jalview's functions.

Release Date:
Status:
Availability:
Data type:
Techniques:
Software:
Technology:
Platform:
Requirements:

Project development

Institution: University of Dundee

StratomeX


StratomeX is a tool designed for the discovery and characterization of disease subtypes based on genomic and clinical data of patient cohorts with hundreds of patients. The tool provides an interactive interface that enables analyst to quickly explore complex and heterogeneous datasets. 

Stratomex is part of Caleydo, an open source visual analysis framework targeted at biomolecular data.

Release Date:
Status:
Availability:
Data type:
Techniques:
Software:
Technology:
Platform:
Requirements:

Project development

Institution: Harvard

ePMV

The open-source uPy plugin, embedded Python Molecular Viewer (ePMV) runs molecular-modeling software directly in several professional 3D animation applications (hosts). Uniting host and scientific software in a single interface allows users from varied backgrounds to assemble professional quality visuals and to perform computational experiments with relative ease

Release Date:
Status:
Availability:
Data type:
Techniques:
Software:
Technology:
Platform:
Requirements:

Project development

Institution: The Scripps Research Institute

Tableau

Tableau is general purpose data visualization software that's been used at the Broad Institute since 2010 for analyzing, monitoring, and optimizing genomic sequencing operations. The Broad's cancer group is also using Tableau for genotype expression data. Tableau connects to all standard business databases (e.g. Oracle, MySQL) and file types (e.g. CSV, Excel). 

Release Date:
Status:
Availability:
Data type:
Techniques:
Software:
Technology:
Platform:
Requirements:

Project development

Institution: Broad Institute of MIT and Harvard

IGV

The Integrative Genomics Viewer (IGV) is a high-performance visualization tool for interactive exploration of large, integrated genomic datasets. It supports a wide variety of data types, including array-based and next-generation sequence data, and genomic annotations.

Release Date:
Status:
Availability:
Data type:
Techniques:
Software:
Technology:
Platform:
Requirements:

Project development

Institution: Broad Insitute

Pages