Open source

You are here

Open source software license

Integrated Genome Browser

The Integrated Genome Browser (IGB, pronounced Ig-Bee) is a fast, flexible, and free desktop genome browser. First developed at Affymetrix in 2001 to support visual analytics of genome tiling arrays, IGB provides an advanced, highly customizable environment for exploring and analyzing large-scale genomic data sets.

Using IGB, you can:

  • View your RNA-Seq, ChIP-chip or ChIP-seq data alongside genome annotations and sequence.
  • Investigate alternative splicing, regulation of gene expression, epigenetic modifications of DNA, and other genome-scale questions.
  • View results from aligning short-read sequences onto a target genome, identify SNPs, and check alignment quality.
  • Copy and paste genomic sequences for further analysis into other tools, such as primer design and promoter analysis tools.
  • Create high-quality images for publication in a variety of formats.


IGB features

IGB lets you view results from your own experiments or computational analyses alongside public domain gene annotations, sequences, and genomic data sets, thus making it easier for you to determine how your experiments agree or disagree with current thinking and models of genomic structure.

Some features IGB offers include:

  • Animated zooming. Most genome browsers implement "jump zooming" only, in which you click a zoom button (or other type of control) and then wait for the display to re-draw. In IGB, zooming is animated, allowing you to easily and quickly adjust the zoom level as needed without losing track of your location.
  • Simple Data Sharing System - QuickLoad. IGB implements a very simple, easy-to-use system for sharing data called QuickLoad. You can use the QuickLoad system to set up a Web site you can use to share your data with colleagues, reviewers, and the public.
  • Draggable graphs. You can display genome graphs data (e.g., "bar" and "wiggle" files) alongside and even on top of reference genome annotations, thus making it easier to see how your experimental results match up to the published reference genome annotations. You can reset your graphs to "floating" and click-drag them over annotations to compare your results with annotations and others' experiments.
  • Edge-matching across tracks. When you click an item in the display, the edges of other items in the same or different tracks with identical boundaries light up, highlighting interesting similarities or differences across gene models, sequence reads, or other features.
  • Integration with local and remote external data sources. IGB can load data from a variety of sources, including Distributed Annotation Servers, QuickLoad servers, ordinary Web sites, and local files.
  • Intron-trimming sliced view. In many species, introns are huge when compared to the exonic (coding) regions of genes. IGB provides a Sliced View tab that trims uninformative regions from introns.
  • Web-controls. IGB can be controlled from a web browser or any other program capable of sending HTTP requests. Via IGB links, you can create Web pages that direct IGB to scroll to a specific region and load data sets from local files or servers.
  • Scripting. IGB understands a simple command language that allows users to write simple scripts directing IGB to show a genome, zoom and scroll to specific regions, and other functions.
  • Open source. All development on IGB proceeds via a 100% open source model. The license allows developers to incorporate IGB (and its components) into new applications.
Release Date:
Status:
Availability:
Data type:
Techniques:
Software:
Technology:
Platform:
Requirements:

Project development

Institution: UNC @ Charlotte

GraphiteLifeExplorer

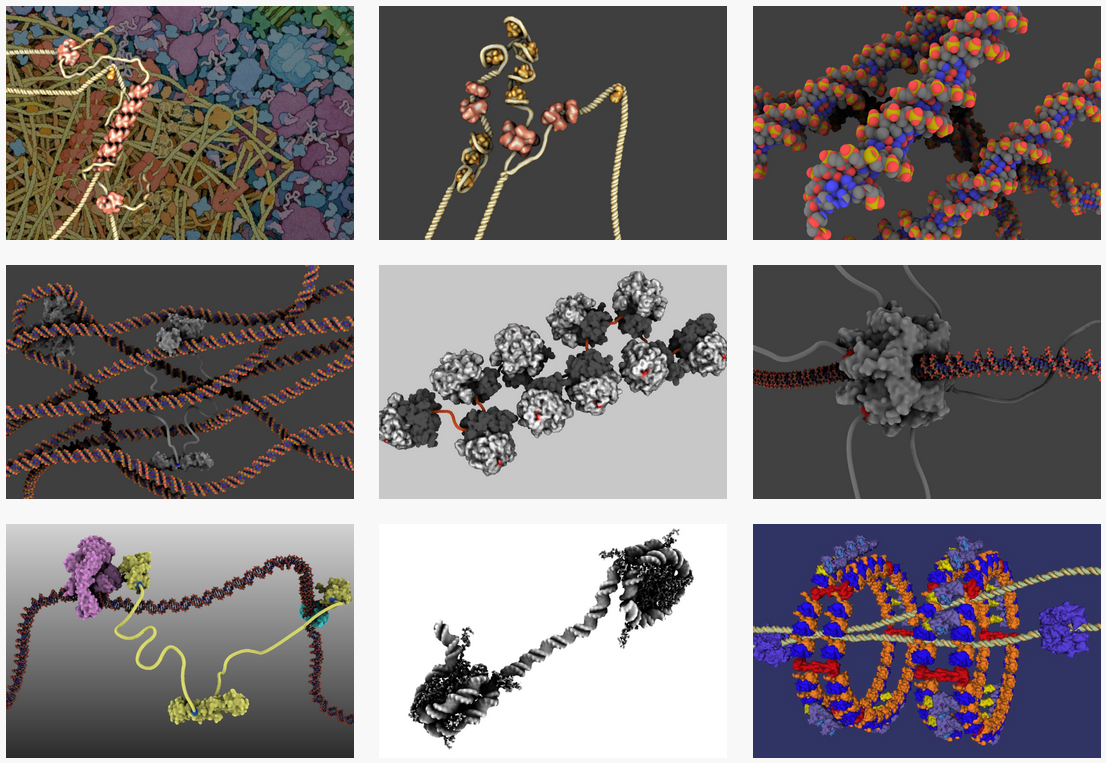
The GraphiteLifeExplorer modeling tool allows to build 3D molecular assemblies of proteins and DNA from Protein Database (PDB) files. Atomic DNA can be modeled from scratch or reconstructed from simulation.

Release Date:
Status:
Availability:
Data type:
Techniques:
Software:
Technology:
Platform:
Requirements:

Project development

Institution: Fourmentin-Guilbert Scientific Foundation & Inria

The LifeExplorer initiative aims at providing a multiscale modelisation of a complete bacteria.

One software is currently available: GraphiteLifeExplorer

OMERO

From the microscope to publication, OMERO handles all your images in a secure central repository. You can view, organize, analyze and share your data from anywhere you have internet access. Work with your images from a desktop app (Windows, Mac or Linux), from the web or from 3rd party software. Over 130 image file formats supported, including all major microscope formats.

Release Date:
Status:
Availability:
Data type:
Techniques:
Software:
Technology:
Platform:
Requirements:

Project development

Institution: University of Dundee

http://www.openmicroscopy.org/site/about/development-teams/jason

Aequatus

We present the Aequatus, a web-based tool with novel rendering approaches to visualise homologous, orthologous and paralogous gene structures among differing species or subtypes of a common species. The Aequatus utilises web technologies to provide a fast and intuitive browsing experience over complex comparative data. The Aequatus processes and visualises data directly from the Ensembl Compara and Ensembl Core schema databases by using precalculated genomic alignments from Ensembl Compara and relating them to Ensembl Core to gather genomic feature information, visualising phylogenetic and structural relationships among them via CIGAR strings. Whilst applicable to species with high-quality gold-standard reference genomes such as human or mouse, the Aequatus was designed with large fragmented genome references in mind,  e.g. polyploid plants. The ultimate goal of the Aequatus is to provide a unique and informative way to render and explore complex relationships between genes from various species.

Source Code: https://github.com/TGAC/Aequatus

Release Date:
Status:
Availability:
Data type:
Techniques:
Software:
Technology:
Platform:
Requirements:

Project development

Institution: Earlham Institute

TGAC Browser

We present the TGAC Browser with novel rendering, annotation and analysis capabilities designed to overcome the shortcomings in available approaches. TGAC Browser, being a web-based client, utilises JavaScript libraries to provide a fast and intuitive genome browsing experience. We focus on harnessing Internet architectures as well as localised HPC hardware, concentrating on improved, more productive interfaces and analytical capabilities.

  • User-friendly: Live data searching, track modification, and drag and drop selection; actions that are seamlessly powered by modern web browser
  • Responsiveness: Client-side rendering and caching, based on JSON fragments generated by server logic, helps decrease the server load and improves user experience
    • TGAC Browser visualises genomic data in different ways, based on the type and amount of data, which is more informative to the user and memory efficien
  • Analysis Integration: The ability to carry out heavyweight analysis tasks, using tools such as BLAST, via a dedicated extensible daemon
  • Annotation: Users can edit annotations which can be persisted on the server, reloaded, and shared at a later date
  • Off-the-shelf Installation: The only prerequisites are a web application container, such as Jetty or Tomcat, and a standard Ensembl database to host sequence features
  • Extensible: Adaptable modular design to enable interfacing with other databases, e.g. GMOD
  • Data format: TGAC Browser processes and visualises data directly from the Ensembl core schema as well as next-generation sequencing (NGS) data output, i.e. BAM/SAM, BigWig/wig, GFF, and VCF.
  • Manual Annotation: Live editing of Genomics annotations within TGAC Browser, saved with versions and can be reverted, exported in Genomics data format for curator to edit datasets (Under development).

Email: Anil.Thanki@earlham.ac.uk

Source Code: https://github.com/tgac/tgacbrowser


Release Date:
Status:
Availability:
Data type:
Techniques:
Software:
Technology:
Platform:
Requirements:

Project development

Institution: Earlham Institute

NN-tanglegram

Motivation: In systematic biology, one is often faced with the task of comparing different phylogenetic trees, in particular in multigene analysis or cospeciation studies. One approach is to use a tanglegram in which two rooted phylogenetic trees are drawn opposite each other, using auxiliary lines to connect matching taxa. There is an increasing interest in using rooted phylogenetic networks to represent evolutionary history, so as to explicitly represent reticulate events, such as horizontal gene transfer, hybridization or reassortment. Thus, the question arises how to define and compute a tanglegram for such networks. Results: In this article, we present the first formal definition of a tanglegram for rooted phylogenetic networks and present a heuristic approach for computing one, called the NN-tanglegram method.
We compare the performance of our method with existing tree tanglegram algorithms and also show a typical application to real biological datasets. For maximum usability, the algorithm does not require that the trees or networks are bifurcating or bicombining, or that they are on identical taxon sets. Availability: The algorithm is implemented in our program Dendroscope 3, which is freely available from www.dendroscope.org.

Release Date:
Status:
Availability:
Data type:
Techniques:
Software:
Technology:
Platform:
Requirements:

Project development

Institution: Center for Bioinformatics (ZBIT), Tübingen University, Sand 14, 72076 Tübingen, Germany; ; Institut des Sciences de l’Evolution Montpellier (ISEM), CNRS UMR 5554, Université Montpellier II, Montpellier, France

ArkMAP

ArkMAP is a desktop application to draw and align genetic and genomic maps, retrieved from remote data sources or loaded as local files. Maps can be retrieved from our public map database ArkDB or from any Ensembl data source (i.e. Ensembl and Ensembl Genomes). By using the JEnsembl API, maps can be drawn for any release version of any of the thousands of species present in Ensembl data sources, allowing not only inter-specific comparisons, but also comparisons between different versions/revisions of assembled genomes. Maps can be aligned by relating identical or synonymous markers across maps, or through the gene homology/orthology relationship data stored in the Ensembl Compara databases, allowing ready visualization of regions of conserved synteny between species. The map drawing canvas is highly configurable, supports interactive exploration of maps, markers and relationships and allows export of publication quality graphics.

Release Date:
Status:
Availability:
Data type:
Techniques:
Software:
Technology:
Platform:
Requirements:

Project development

Institution: University of Edinburgh

BioFabric

BioFabric uses a novel network visualization technique that depicts nodes as one-dimensional horizontal lines arranged in unique rows. This is in distinct contrast to the traditional approach that represents nodes as discrete symbols that behave essentially as zero-dimensional points. BioFabric then depicts each edge in the network using a vertical line assigned to its own unique column, which spans between the source and target rows, i.e. nodes. This method of displaying the network allows a full-scale view to be organized in a rational fashion; interesting network structures, such as sets of nodes with similar connectivity, can be quickly scanned and visually identified in the full network view, even in networks with well over 100,000 edges. This approach means that the network is being represented as a fundamentally linear, sequential entity, where the horizontal scroll bar provides the basic navigation tool for browsing the entire network.

Release Date:
Status:
Availability:
Data type:
Techniques:
Software:
Technology:
Platform:
Requirements:

Project development

Institution: Institute for Systems Biology

Dendroscope

The program is a visualization tool for large phylogenetic trees and rooted phylogenetic networks. Now on v3.

The program is open source and installers are available for Windows 10, MacOS X and Linux

Release Date:
Status:
Availability:
Data type:
Techniques:
Software:
Technology:
Platform:
Requirements:

Project development

Institution: University of Tubingen

v.3 released.

Variant View


Variant View is a visualization tool for analyzing genetic sequence variants.

Variant View is useful to domain experts in several ways: First, it integrates diverse data types previously distributed across input files and external databases. Second, it provides summary metrics that are valuable for sorting genes and identifying candidates for further exploration. Third, it displays rich information about variant type and distribution across a gene. This information is not available in any other visualization tool and is valuable for interpreting the biological impact of variants, which requires human inspection.

Release Date:
Status:
Availability:
Data type:
Techniques:
Software:
Technology:
Platform:
Requirements:

Project development

Institution: University of British Columbia

Pages