
Combing the hairball with BioFabric: a new approach for visualization of large networks
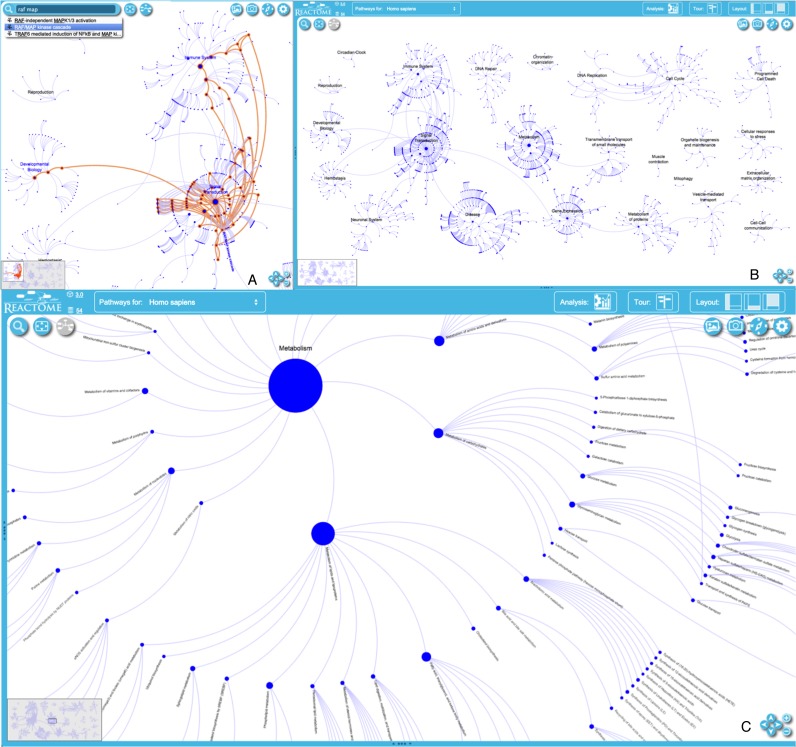
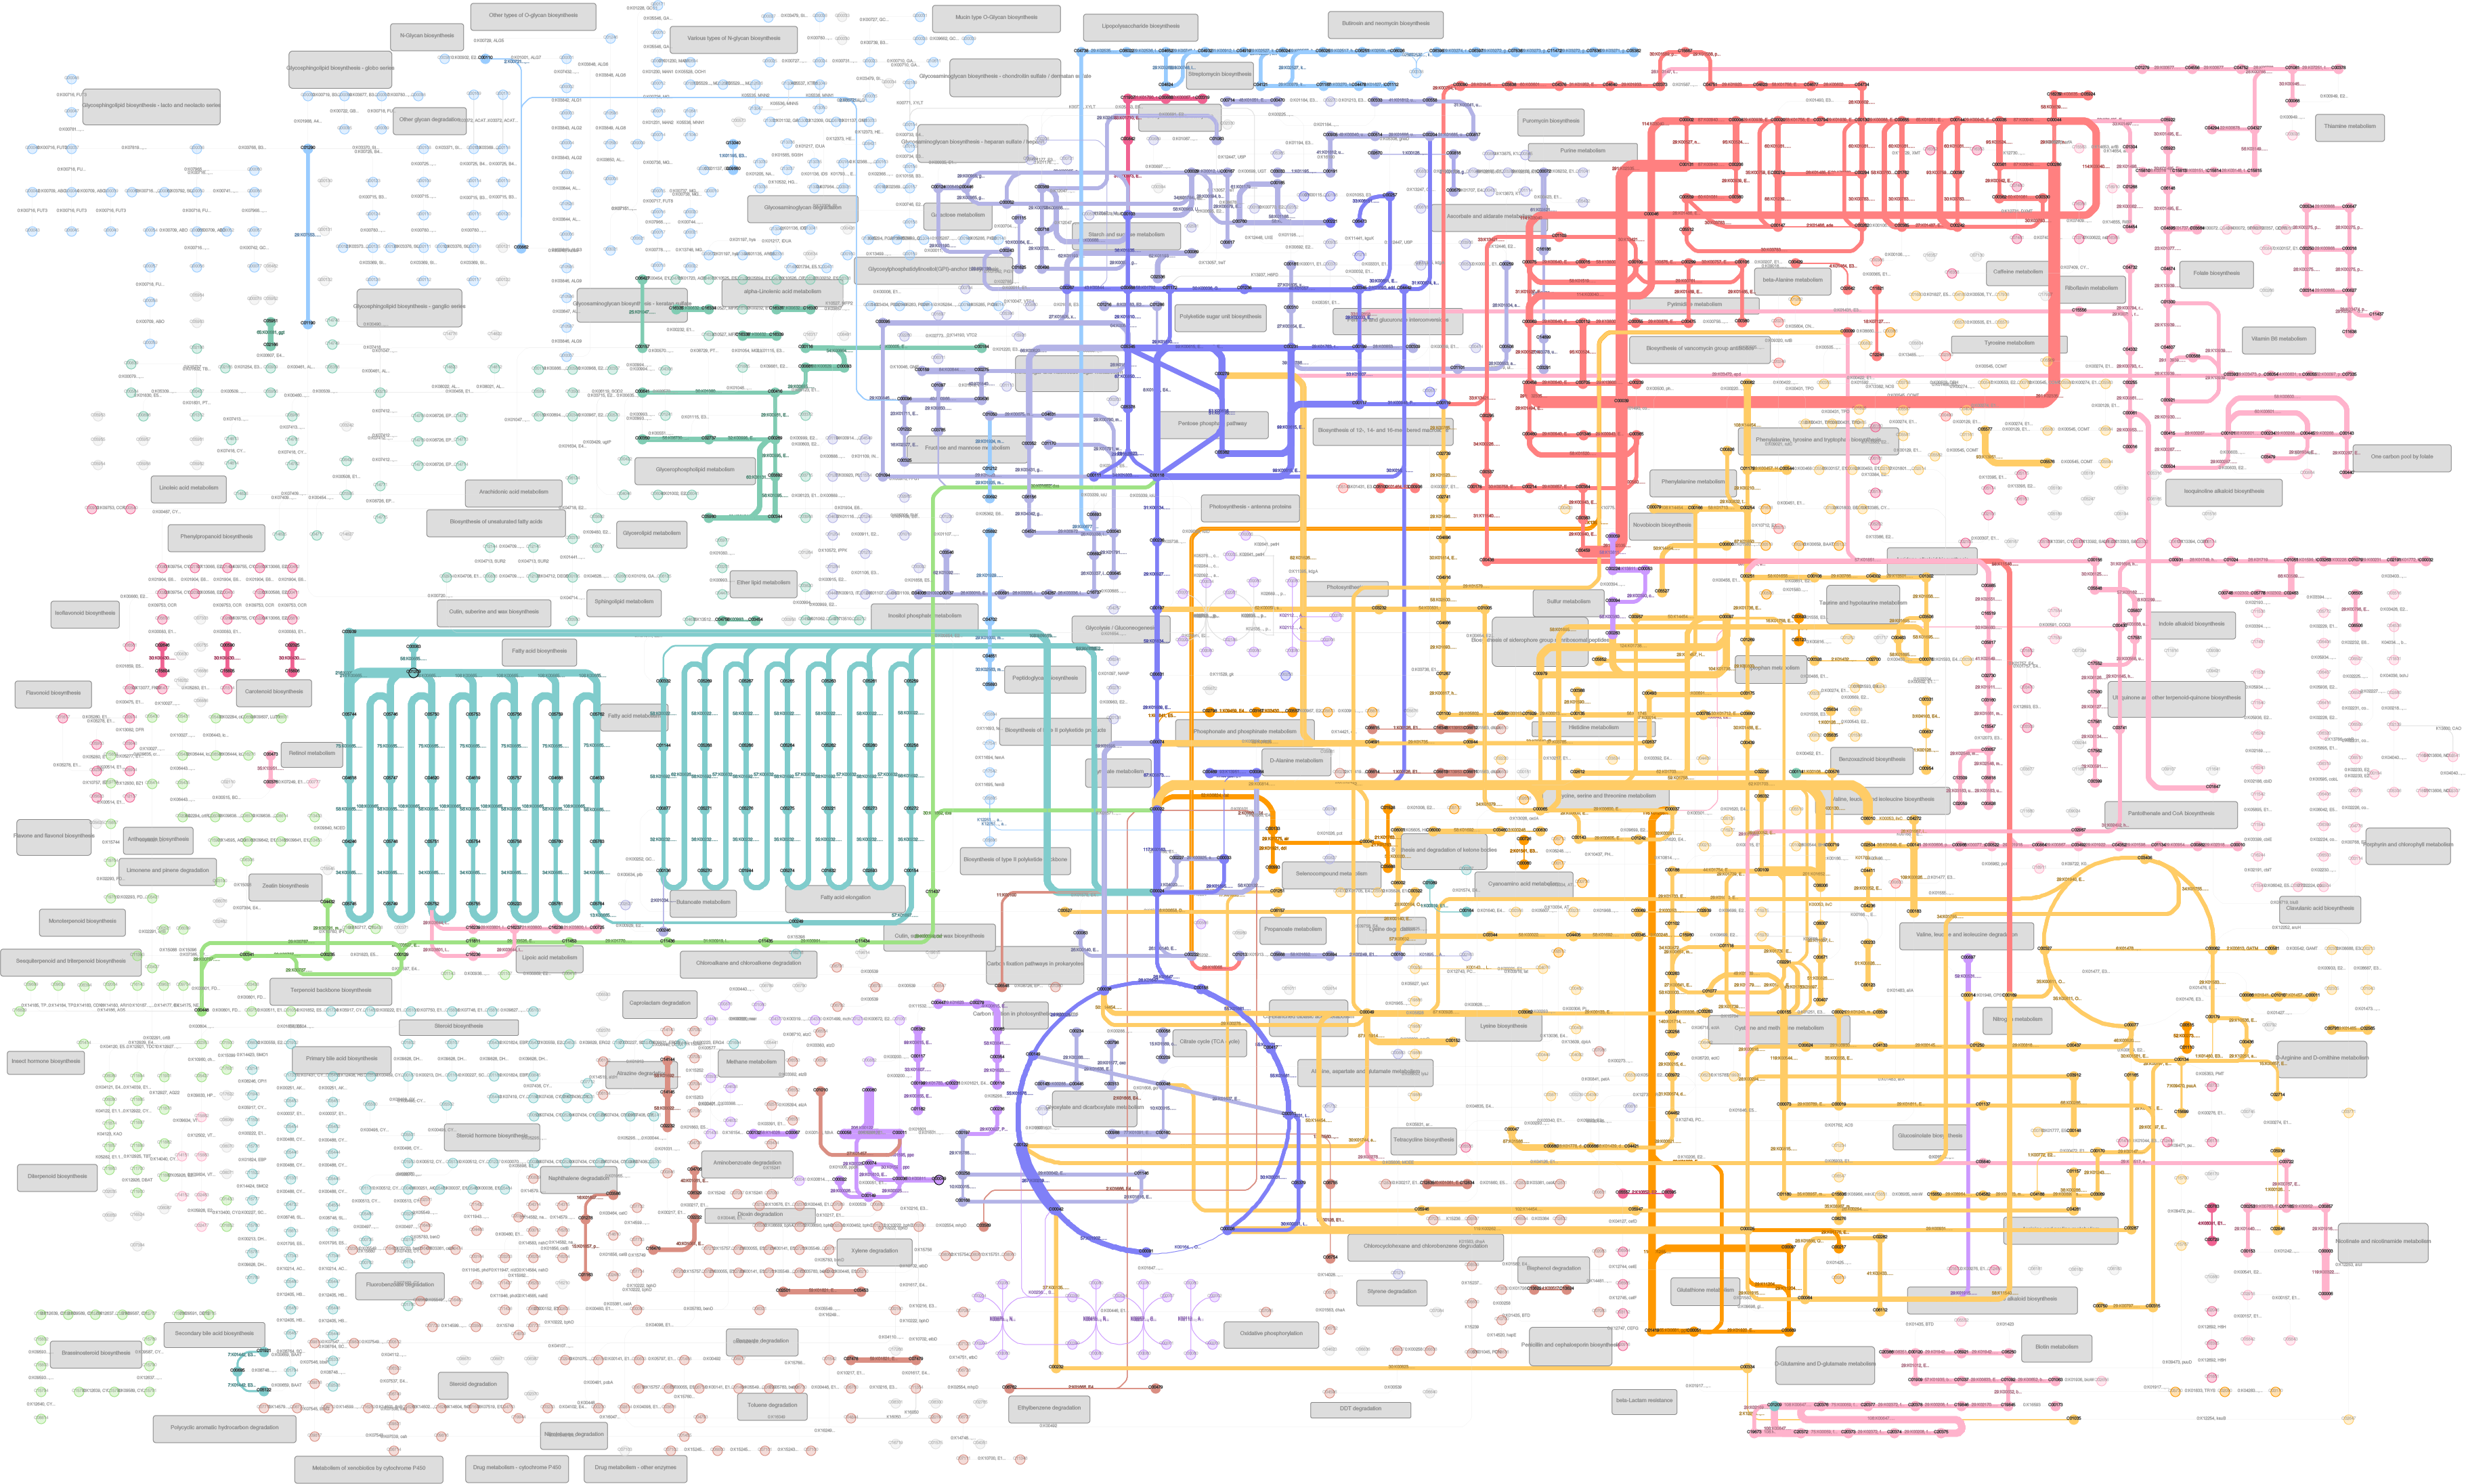
BioFabric uses a novel network visualization technique that depicts nodes as one-dimensional horizontal lines arranged in unique rows. This is in distinct contrast to the traditional approach that represents nodes as discrete symbols that behave essentially as zero-dimensional points. BioFabric then depicts each edge in the network using a vertical line assigned to its own unique column, which spans between the source and target rows, i.e. nodes. This method of displaying the network allows a full-scale view to be organized in a rational fashion; interesting network structures, such as sets of nodes with similar connectivity, can be quickly scanned and visually identified in the full network view, even in networks with well over 100,000 edges. This approach means that the network is being represented as a fundamentally linear, sequential entity, where the horizontal scroll bar provides the basic navigation tool for browsing the entire network.
| Release Date: | |
| Status: | |
| Availability: | |
| Data type: | |
| Techniques: | 2D, Network / hierarchy graph |
| Software: | Installed |
| Technology: | java |
| Platform: | Mac OSX, Windows |
| Requirements: |
Project development
Last updated on 25th January, 2017


