
Themes:
interactive visual analytics for functional genomics data
interactive visual analytics for functional genomics data
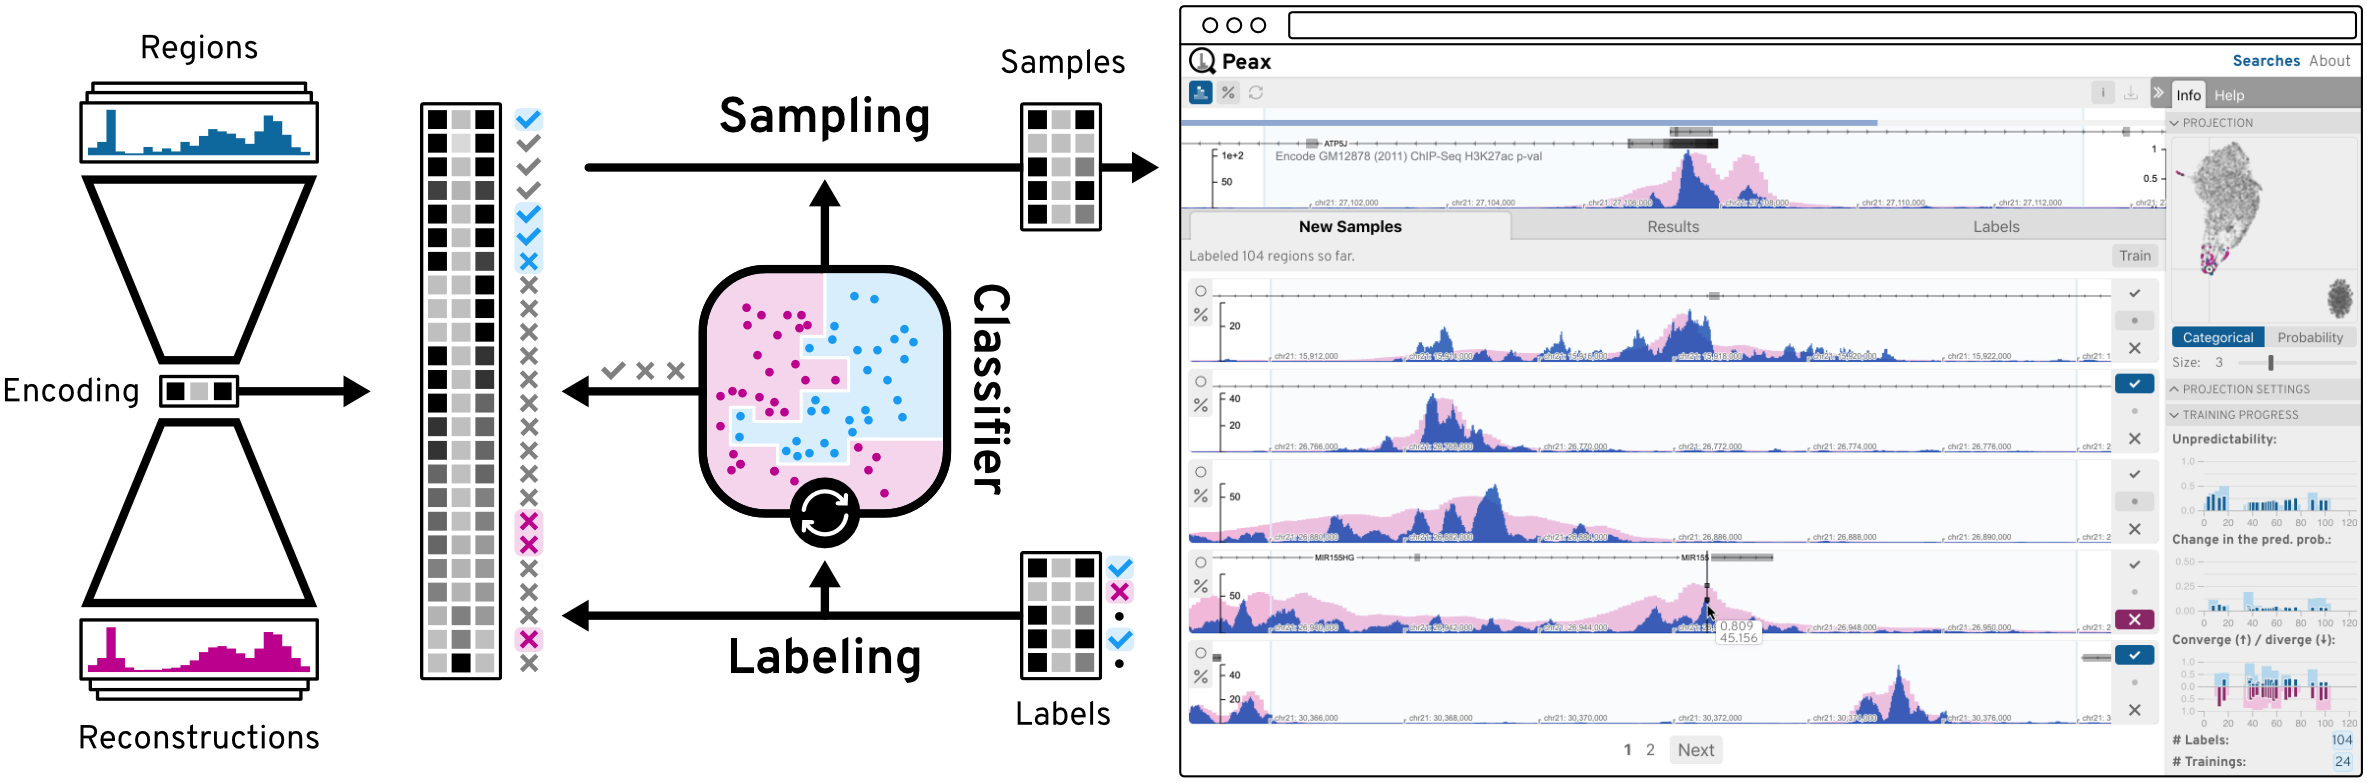
Visualization is an integral aspect of genomics data analysis. Algorithmic-statistical analysis and interactive visualization are most effective when used iteratively. Epiviz, a web-based genome browser, and the Epivizr Bioconductor package allow interactive, extensible and reproducible visualization within a state-of-the-art data-analysis platform.
| Release Date: | |
| Status: | |
| Availability: | |
| Data type: | |
| Techniques: | 2D |
| Software: | Web based |
| Technology: | |
| Platform: | Linux, Mac OSX, Windows |
| Requirements: |
Project development
Institution:
University of Maryland, USA
Last updated on 7th February, 2017
- Log in to post comments


